
DeepSeek Harness Error Messages, Decoded: What Each One Means and How to Fix It
Almost every error you’ll hit in this tool traces back to one of four things: how it was installed, a plugin that never finished starting, a corrupted session log, or the fact that DeepSeek Harness is still labeled a developer preview. Once you know which bucket a message belongs to, the fix is usually a single command — the project repository is the place to confirm you’re reading the right version before you dig further. Most of the install-time failures below are specific to one platform, and they are worked through separately in running DeepSeek Harness on Windows.
This guide is written by the DSH Field Guide, an independent, community-run reference for DeepSeek Harness (dsh). It is not affiliated with, endorsed by, or operated by DeepSeek — “DeepSeek” and “DeepSeek Harness” are trademarks of their respective owner. Every symptom below is quoted from the tool’s own official documentation or from a public support thread, with a link back to the source.
Before you debug anything: this is a developer preview
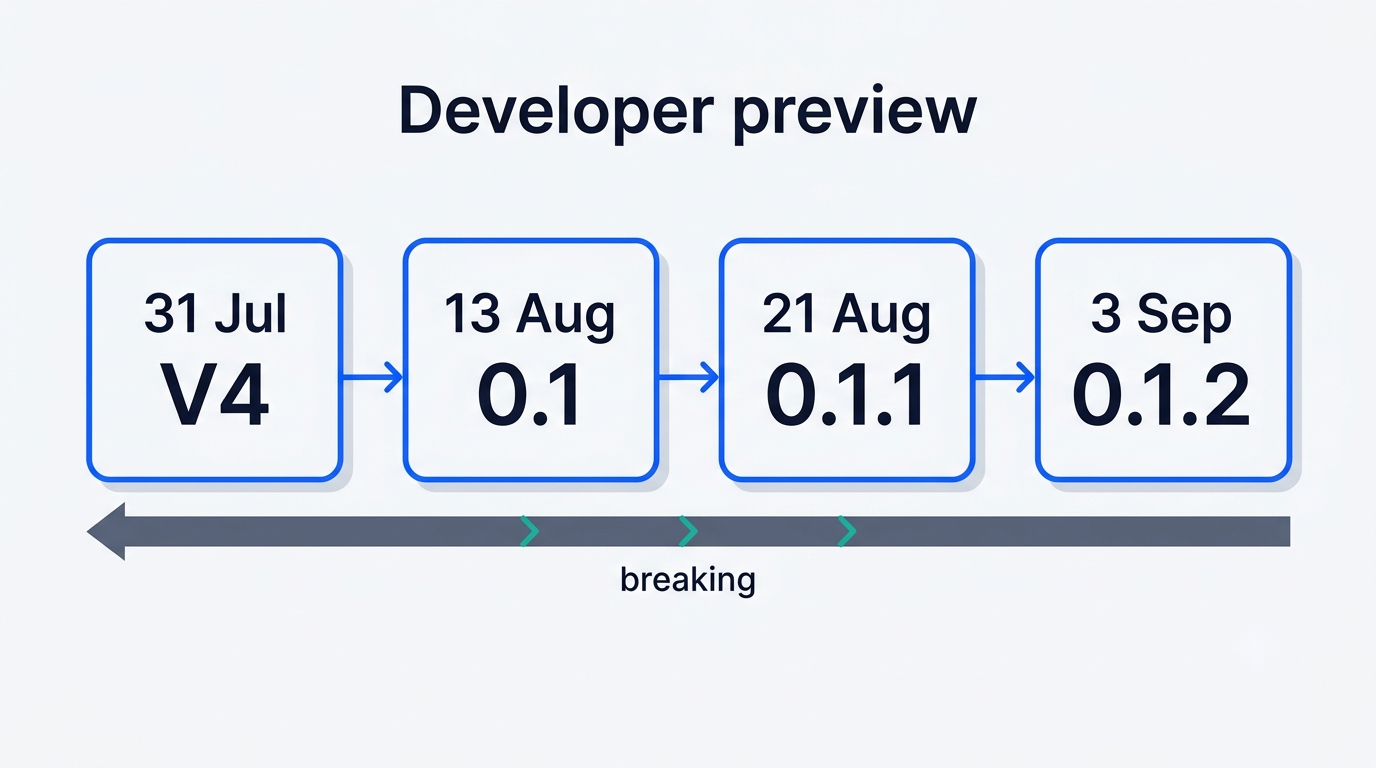
Part of what looks like breakage isn’t a misconfiguration — it’s a direct consequence of where the project is in its lifecycle. DeepSeek Harness shipped on August 13, 2026, alongside the V4-Pro-0813 model; the underlying capabilities had already landed inside the July 31 V4 release, and the earliest commit in the public history is dated August 14, which is why some coverage treats that second date as the actual open-sourcing moment. In three weeks the project moved through three version branches — 0.1, then 0.1.1 on August 21, then 0.1.2-rc.1 on September 3. Issues and pull requests are disabled on the repository; all bug reports and workarounds live in GitHub Discussions and Discord instead.
THERE WILL BE COMPATIBILITY-BREAKING CHANGES— deepseek-ai/deepseek-harness README
That warning is not boilerplate. Several of the errors documented below — the corrupted session log, the schema rejection on tool calls — are literally the visible edge of a breaking change that shipped between two releases days apart. Before you search for a message verbatim, check which build produced it; a fix that landed in 0.1.1 can look identical to a bug that’s still open in 0.1.2-rc.1.
How to read an error before you search for it
The first question is always the same: did the message come from the installer, the plugin loader, the tool registry, or the API itself? Running dsh --profile web --dump-config prints the configuration tree as it actually assembled, which cuts out half the guessing before you touch a search engine.
Install errors: npx hangs, or dies with a heap out of memory
The installer is where the largest share of first-run frustration comes from, and none of it is really about your machine. npx @deepseek-ai/dsh web can die outright or simply sit there for the better part of half an hour, and the two symptoms share one root cause.
Symptom: FATAL ERROR: Reached heap limit
The exact text is FATAL ERROR: Reached heap limit Allocation failed - JavaScript heap out of memory. It surfaces after roughly 523 seconds with nothing printed beforehand; an isolated npm install @deepseek-ai/dsh fails even faster, dying at 379 seconds with zero packages installed (Discussion #4872).
Cause: npm’s resolver, not your machine
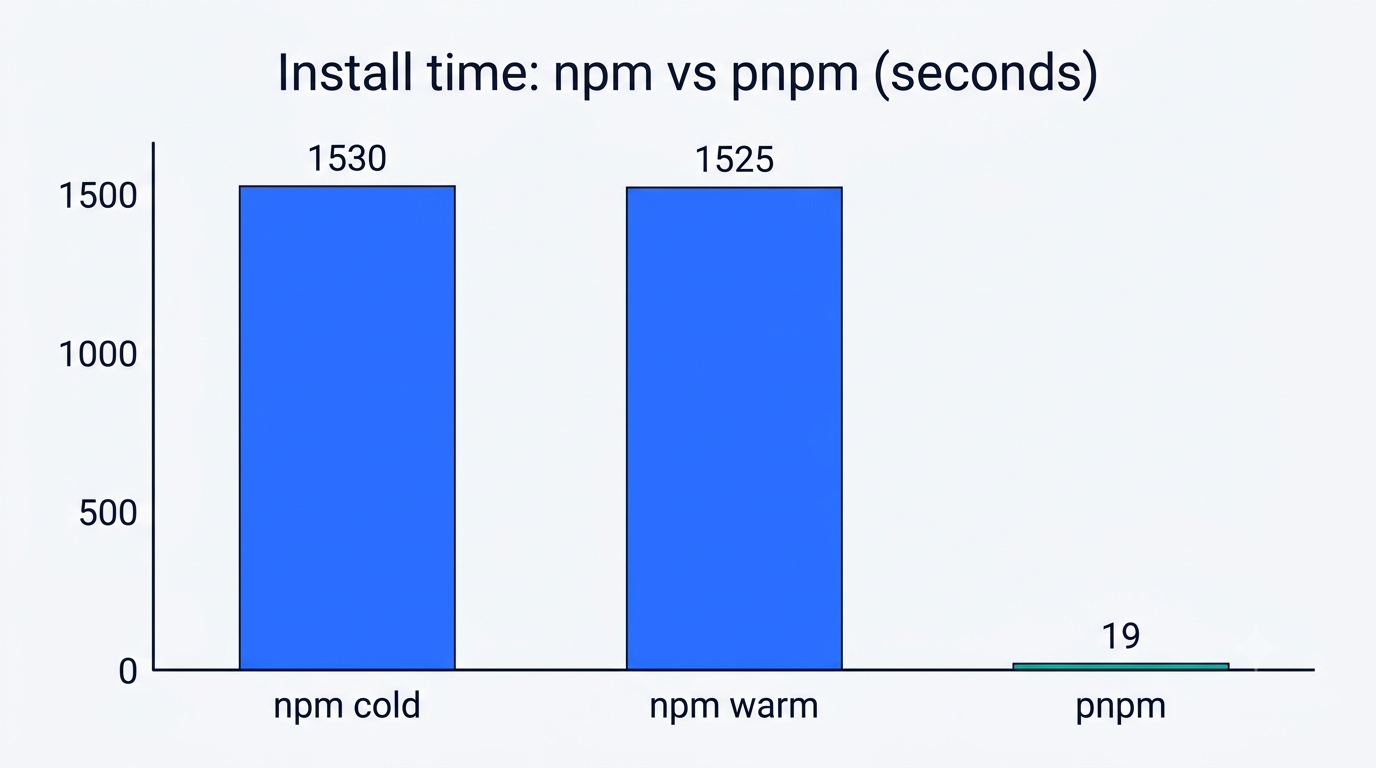
Behind the scenes sits a dependency graph of roughly 500 internal @deepseek-ai/dsh-* packages with circular peer conflicts. npm’s resolver grows combinatorially against that shape. The project’s own CI never exercises the npm/npx path at all — the repository ships a pnpm-workspace.yaml and is pnpm-native. On Windows 10, npx -y @deepseek-ai/dsh --version can sit silently for 1,530 seconds before printing a version, and a warm cache barely helps, at 1,525 seconds (Discussion #5533). There are no postinstall scripts involved — the entire cost is a sequential dependency reify inside npm’s Arborist resolver.
Fix: install with pnpm
The same dependency tree — 197 packages, 260 MB — installs through pnpm install with a cold store in about 19 seconds. In practice the fastest path is one command: pnpm dlx @deepseek-ai/dsh web --no-open. On a low-memory machine, NODE_OPTIONS=--max-old-space-size=2048 helps further. One thing not to reach for: --legacy-peer-deps does complete quickly, in about 36 seconds, but it produces a broken tree that crashes at runtime with ERR_MODULE_NOT_FOUND: Cannot find package '@deepseek-ai/cordis-plugin-group' (#4872).
| Install path | Time to finish | Result |
|---|---|---|
npm install @deepseek-ai/dsh | ~379s | Fails, 0 packages installed |
npx @deepseek-ai/dsh --version (Windows, cold) | ~1,530s | Eventually succeeds |
npx @deepseek-ai/dsh --version (Windows, warm cache) | ~1,525s | Eventually succeeds, cache doesn’t help |
npm install --legacy-peer-deps | ~36s | Installs, but breaks at runtime |
pnpm install (cold store) | ~19s | Succeeds, clean tree |
If you’re on a memory-constrained container — a small WSL2 VM at 3 GB of RAM is a documented example — npm can throw the same heap error in under six minutes even though dsh itself starts in under a second once installed correctly (#5533). That gap alone is a good sign you’re fighting the resolver, not the runtime.
Failed to load plugins: why dsh web refuses to start
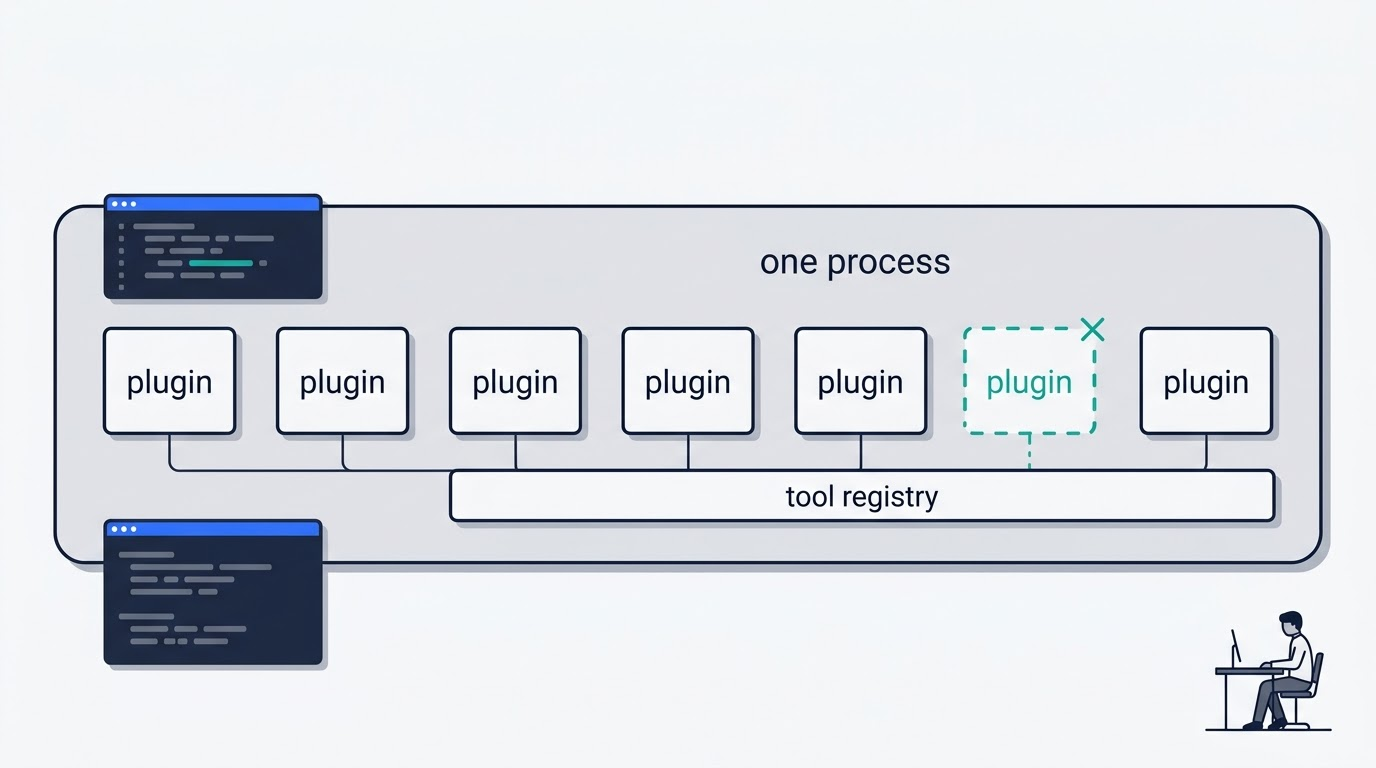
DeepSeek Harness runs its plugin system on Cordis, and Cordis plugins share one process, one context object, and one tool registry — there’s no per-plugin isolation. That design choice explains most of the errors in this section, and it’s worth reading before you go plugin-hunting.
A single bad native dependency takes the whole process down. Messages like Could not load the "sharp" module using the win32-x64 runtime or Cannot find package ... node-pty don’t just disable one plugin — they crash dsh web entirely, because the loader synchronously imports the entry point of every installed bundle at startup rather than isolating failures (Discussion #1884).
inject written as an object instead of an array leaves a plugin permanently pending. The message reads 1 entry did not activate my-plugin: pending (waiting for services: required, optional). Almost always the cause is inject: { required: [...], optional: [...] } — Cordis reads that shape as a request for two services literally named required and optional. The correct form is a flat array of strings. A related failure, cannot get property "credentials" without inject, comes from reading a property on a service that was never injected; Cordis returns a Proxy that throws on access, so an optional-chaining ?. does not protect against it (#1884).
Symptom: –expose-internals is required for HMR service
The literal text is Error: failed to apply loader entry 4274232c (@deepseek-ai/cordis-plugin-hmr): --expose-internals is required for HMR service, thrown from vendor/hmr/src/index.ts:121:13 (Discussion #2699). The message is misleading — the real trigger is usually that a native binding package, node-addon-require-builtin-*, fails to resolve, and an empty catch block silently swallows the failure and returns undefined. Setting NODE_OPTIONS=--expose-internals will not fix it: Node rejects that flag when it’s passed through the environment variable rather than as a direct argument. What works is either running node directly with the flag — node --expose-internals --import tsx/esm apps/cli/src/bin.ts web — or running corepack enable and reinstalling on the pinned pnpm 11.7.0 that Node.js supports out of the box.
Why AI-written plugins break more often than hand-written ones
Because every plugin shares the same registry, two plugins that happen to register a tool or service under the same name will either fail outright or silently overwrite one another — the outcome isn’t predictable. The community write-up that documents this pattern was published against @deepseek-ai/dsh 0.1.0-rc.6 on August 15, 2026, only two days after the developer preview shipped (#1884).
Because the tool registry is shared, understanding what DeepSeek Harness is and how its plugin tree is wired matters more here than in tools where plugins are sandboxed. Here’s a short sequence for narrowing down which plugin is actually at fault, rather than guessing from the error text alone:
- Run
dsh --profile web --dump-configand check whether the plugin appears in the resolved tree at all. - Read the startup log from the top — the first plugin that throws is usually the real cause, not the last message printed.
- Temporarily remove or disable plugins one at a time, starting with anything that has a native dependency (sharp, node-pty, MCP clients).
- Reinstall with
pnpmto rule out a broken install rather than a broken plugin. - Check
injectdeclarations for object-vs-array mistakes before assuming a service is genuinely missing. - If the plugin loads but a tool from it is missing, move to the registry section below.
- If nothing isolates it, open a comment on the closest matching Discussions thread rather than filing a new one — the maintainers triage by thread.
Unknown tool: the model calls something the registry does not have
Cause 1: the plugin that owned the tool never activated
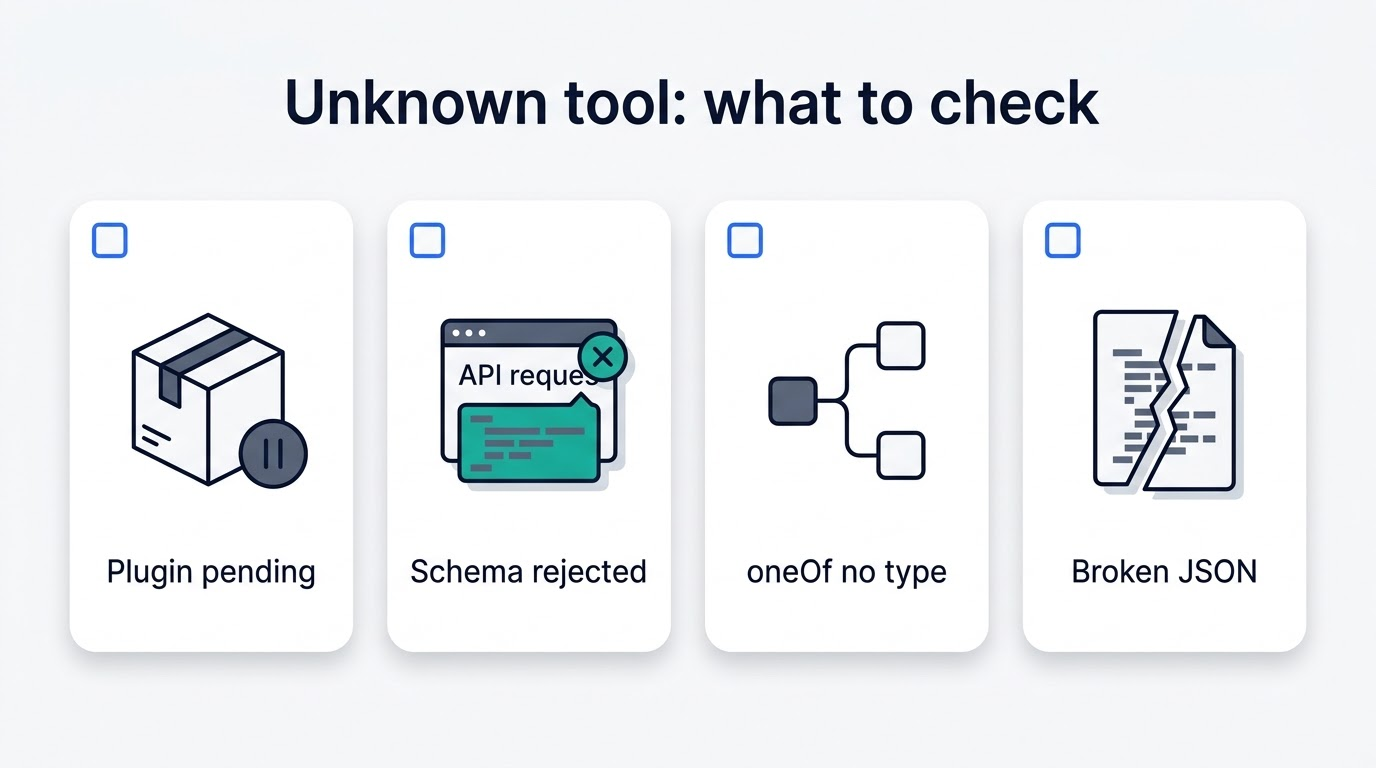
There is exactly one tool registry per process. If a plugin stalled in pending or crashed on a native dependency, its tools simply never made it into that registry — but a model continuing an old session may still try to call them. --dump-config plus the startup log settles this quickly.
Cause 2: the tool schema is rejected by the provider
Parameters written as a shorthand map instead of a full JSON Schema. When parameters is passed as a plain key-value map rather than a proper schema object, it goes to the provider unchanged, and an OpenAI-compatible gateway answers with a 400: schema must be a JSON Schema of type: "object", got type: null. The correct shape is { type: 'object', properties: { ... } }. The shorthand form is only valid for dynamic plugins built with defineTool — not for tools registered through ctx.tools.register (#1884).
Cause 3: oneOf without a top-level type
Parameters declared through oneOf without a top-level type field serialize down to a plain string, and validation against that string always reports zero matches — the tool becomes unusable regardless of what arguments the model sends (Discussion #5512).
Cause 4: the misleading missing-property error
When the model emits truncated JSON, parseArguments‘s catch block returns the raw string instead of throwing, and validateArgs then treats that string as if it were an object. The result is a message like invalid arguments: missing required property "description" even when the tool in question — commonly read — has no description parameter at all. The defect is intermittent: retrying the same call usually succeeds, because the model regenerates valid JSON on the next attempt (#5512).
400 INVALID_REQUEST on dangling tool calls
Symptom and cause
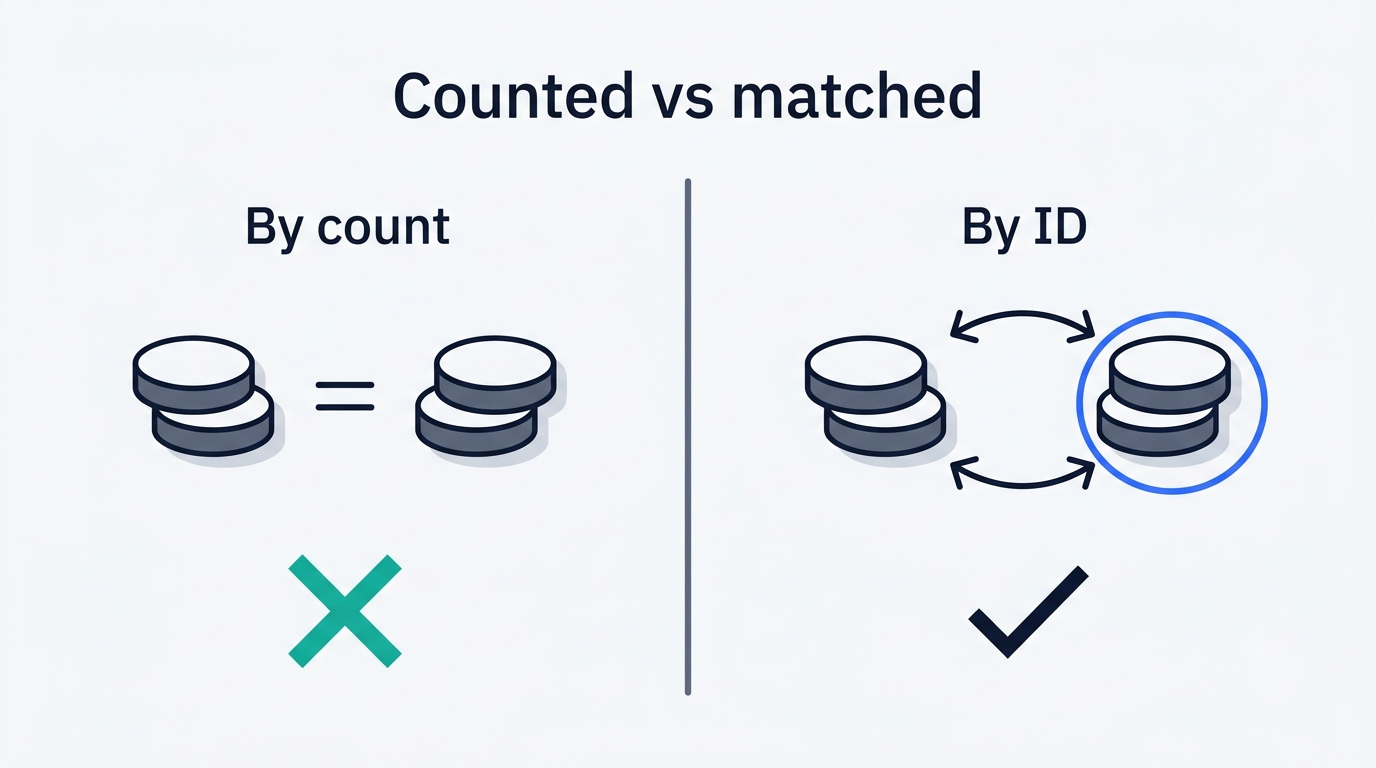
A session accumulates an unpaired tool_calls entry from the assistant, or a tool result with no matching call, and the DeepSeek API answers with 400 INVALID_REQUEST. In the alpha.1 build, tool-pairing.ts balances the message array by count, not by call ID: an array holding [call_A] checked against a results array holding [call_B] computes 1 - 1 = 0 and passes as balanced, even though call_A was never closed and call_B is an orphan with no matching call (Discussion #4843).
What to do now
There is no official fix in a release yet, so the community works around it with a plugin: dsh plugin --profile web add dsh-messages-sanitizer. It repairs the messages array at runtime so the next request going out is valid. Treat it as a stopgap, not a permanent fix — once the upstream pairing logic is corrected, the sanitizer becomes redundant.
Session history disappeared after an update
Symptom
The exact error reads: stored session "session-500c38f0-5793-40c0-91ee-59e3a30b372f" is corrupt: … failed validation: Error: session event at seq 709656 message must have tool source (gateway/internal).
stored session “session-500c38f0-5793-40c0-91ee-59e3a30b372f” is corrupt: … failed validation: Error: session event at seq 709656 message must have tool source (gateway/internal)— DeepSeek Harness Discussions #5525
Cause and what to do
The session event log is append-only and is the single source of truth for a run — the visible conversation history is derived from it, not stored separately. A newer build tightened validation and now rejects an event shape that an older build wrote without complaint, which is exactly the kind of compatibility-breaking change the README warns about. As of this writing there’s no reply from a maintainer in the thread and no fix landed. The practical takeaway is simple: copy your session directory before every update, not after something goes wrong.
Context length does not match, and compaction silently fails
Symptom: the UI shows a smaller window than the provider advertises
A recurring complaint (Discussion #5517) is that the provider advertises a 1M-token window while dsh displays 262k for the same model. The thread sits without a maintainer response. Per the DeepSeek API documentation, both V4 models officially carry a 1M-token context and a 384K maximum output, so the discrepancy likely comes from either a third-party routing layer’s own model catalog, or that route capping the advertised limit on its end.
Symptom: summarization produced no text summary content
compaction-basic sends the full set of tool schemas along with the summarization call but never sets a tool choice — the relevant line is packages/compaction/compaction-basic/src/summarizer.ts:158, and GenerateOptions has no toolChoice field at all. Faced with tool schemas and no instruction to avoid them, the model responds with another tool call instead of a text summary, summaryText() finds no text, and it throws.
summarization produced no text summary content— DeepSeek Harness Discussions #5521
The author’s own measurement is worth quoting directly: 74 compactions across 432 sessions, 25 of them producing no summary, and 15 of those 25 specifically this error — finishing in 3 to 17 seconds versus roughly 131 seconds for a successful compaction. It was confirmed on both 0.1.2-alpha.5 and 0.1.2-rc.1, meaning it survived at least one full release cycle unfixed (Discussion #5521).
Reaching dsh web from outside localhost
Symptom: settings never persist over a hostname
If you didn’t open the interface through localhost, an “Internal Testing Notice” reappears on every reload, and any settings you change survive only for as long as the process stays in memory. The cause is that isLoopback checks exclusively against the page’s hostname — localhost, [::1], or a 127.x.y.z address — and a companion flag, ownsHost, never gets set outside that check, so persistence quietly falls back to a memory-only store. The server already exposes a --trusted-host flag for exactly this situation, but the client never prompts for it (Discussion #5523).
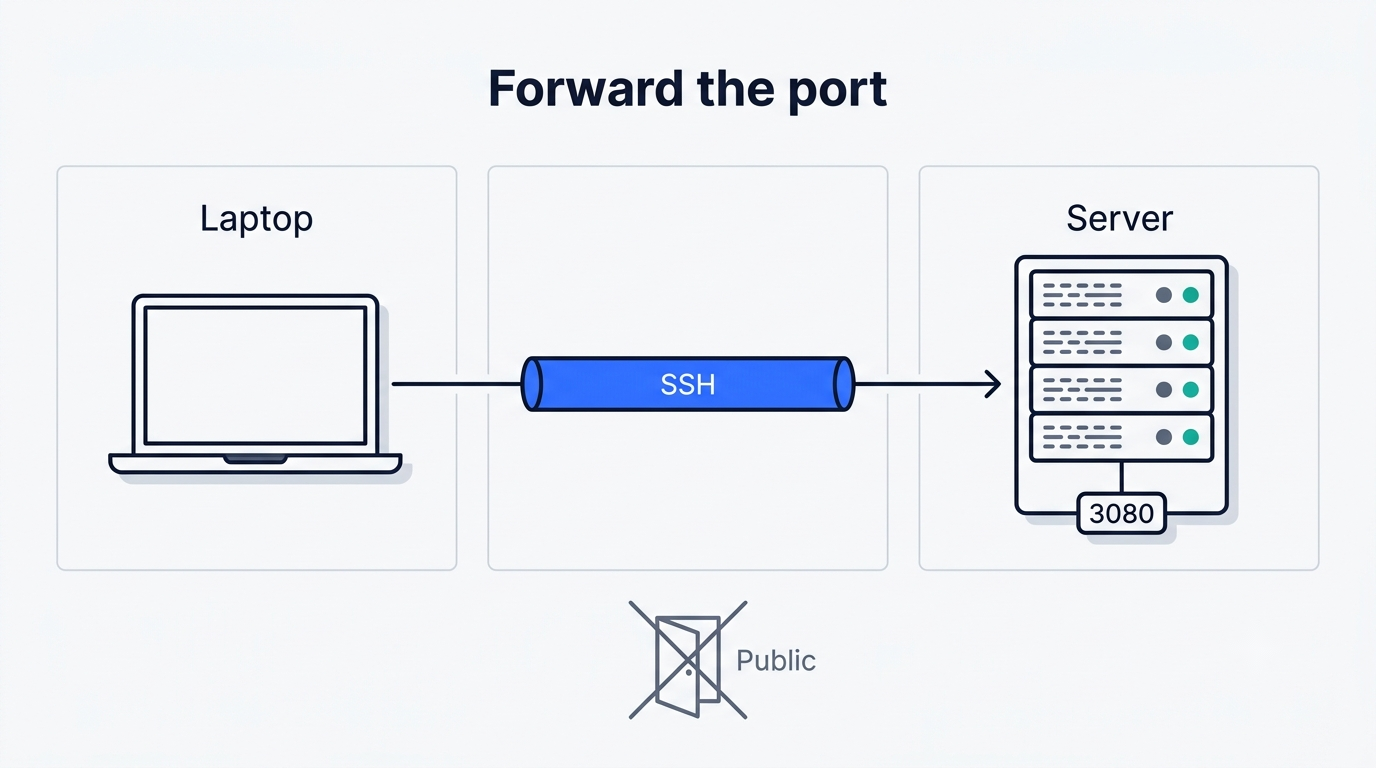
The right fix: forward the port, do not open it
dsh web binds by default to http://127.0.0.1:3080. Started over SSH, it only ever prints that loopback address — reaching it depends entirely on whoever owns the tunnel, typically an SSH client or an editor’s remote extension. The supported path is SSH port forwarding, or the dsh-remote-tunnel plugin: install it with dsh plugin --profile remote add dsh-remote-tunnel, then run dsh --profile remote up <host> --open (Discussion #5530). Opening port 3080 to the network directly is the one option that isn’t recommended anywhere in these threads.
| Access method | What it does | Risk |
|---|---|---|
| SSH port forwarding | Tunnels 127.0.0.1:3080 to your local machine | Low — no port exposed publicly |
dsh-remote-tunnel plugin | Same idea, managed by dsh itself | Low |
| Exposing 3080 on the network interface | Skips the tunnel entirely | Not documented as supported |
Most of the confusion here disappears once you treat DeepSeek Harness (dsh) as a local-first tool that happens to be reachable remotely, rather than a server meant to be exposed directly.
Bonus: port 3080 stays busy
Closing the terminal window instead of stopping the process with Ctrl+C leaves port 3080 held open, and the next launch fails without an informative message. Killing the leftover process before restarting resolves it (Discussion #5506).